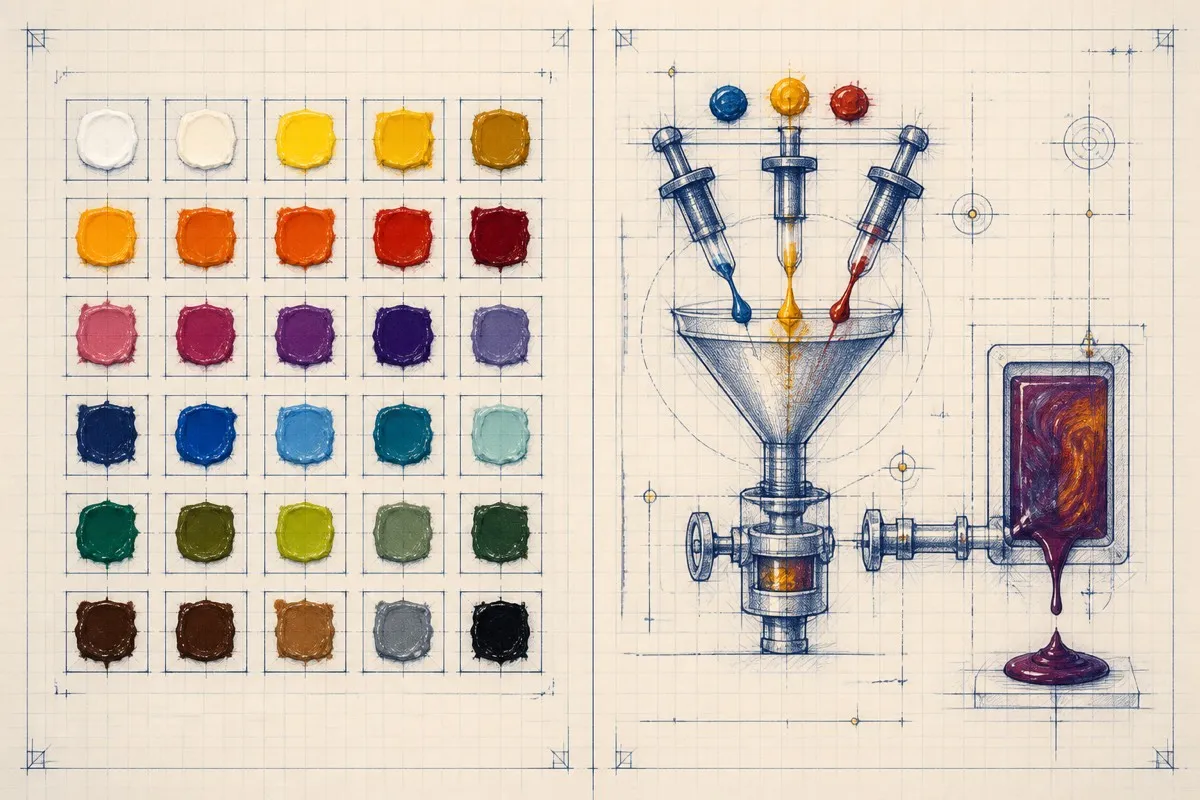
Both a printed paint conversion chart and an interactive matching tool try to answer the same question: which paint in another brand is closest to this one? They get there differently, and neither is right for every situation. A chart is portable and easy to scan at a glance. A tool recalculates live and can go deeper than a single suggested swap. The honest answer is that they are complementary, not rivals.
What a static chart does well
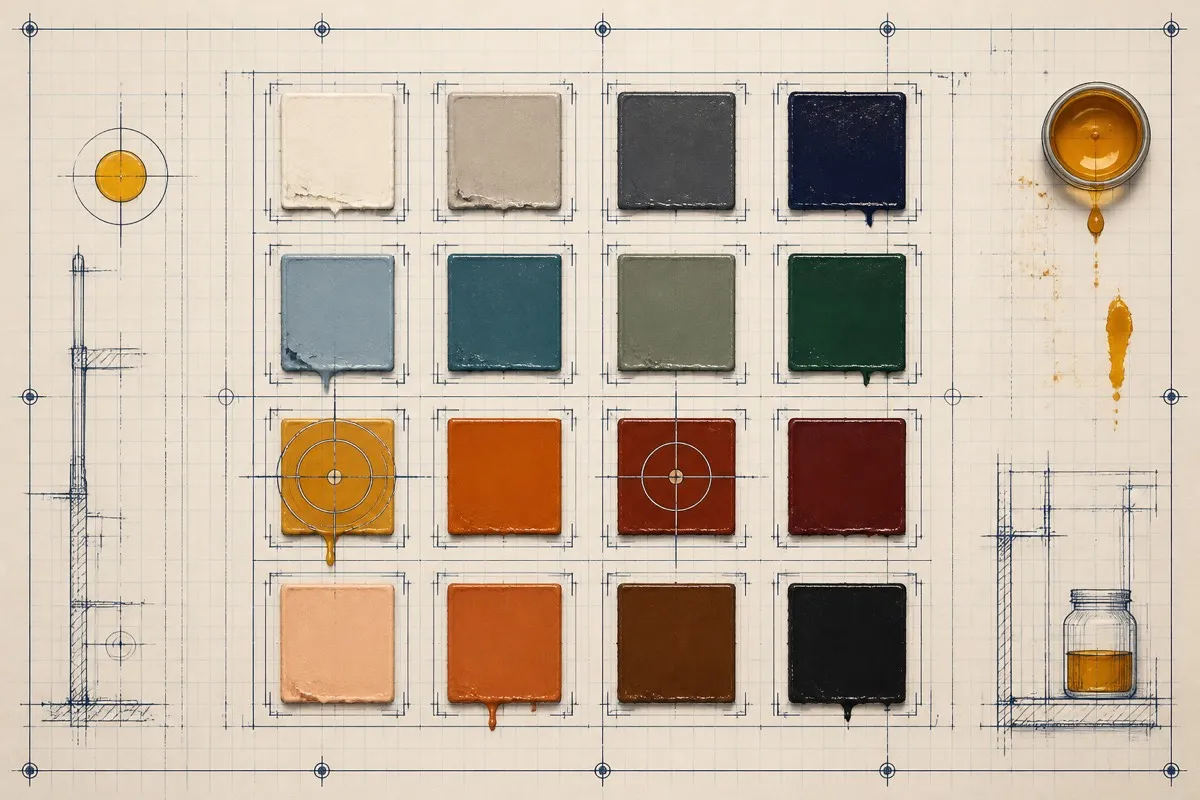
A printed or PDF conversion chart is fast to reference at the painting desk, works without a device nearby, and is easy to scan. Its source and method still need scrutiny: some charts use community suggestions, while others calculate from digital references, and neither label alone proves physical testing.
Where a static chart falls short
A chart is frozen the moment it is published. It does not update when a brand discontinues a color, reformulates a range, or releases new paints, so a chart from a few years ago will quietly miss anything newer. It also usually gives you one suggested match per paint with no confidence score, so you cannot tell whether a listed swap is a near perfect twin or a distant cousin.
What a matching tool does well
An interactive matching tool works from the site’s stored catalog snapshot, so it can include updates when the underlying data is refreshed. It ranks candidates with the same calculation across the catalog instead of returning one unexplained option. Basecoat Lab calculates those scores from approximate stored digital swatches, not physical paint measurements, so the result helps shortlist candidates rather than deciding whether to swap or mix actual paint.
Where a matching tool falls short
A tool cannot see a paint in your hand, and it cannot account for individual bottle-to-bottle variation or an old pot that has thickened over time. It is also only as good as the color data behind it, so it should be treated as a well informed starting point rather than the final word, the same way any conversion resource should be.
| Static chart | Matching tool | |
|---|---|---|
| Works offline at the desk | Yes | No |
| Stays current with new releases | No | Yes |
| Shows more than one ranked option | Rarely | Yes |
| Includes a confidence score | Rarely | Yes |
| Method depends on disclosed source | May use community suggestions or calculations | Uses approximate stored swatches plus catalog finish metadata |
How to use both together
Use a matching tool when you want a ranked view of the site’s stored records. Keep a printed chart or your own notes for the desk reference you can glance at mid session without breaking your workflow. When the two disagree, check the finish type and the similarity score on the tool before trusting either one blindly, since the disagreement usually comes down to how the match was judged rather than one source being simply wrong.
FAQ
Are printed paint conversion charts accurate?
Accuracy depends on the chart’s sources and method. A chart can also become stale as ranges change, and many do not explain how each candidate was selected.
Is an online matching tool better than a chart?
A tool can show ranked, scored digital candidates and can be updated with its dataset. A chart can be easier to scan offline. Neither format proves a physical match without disclosed evidence and paint testing.
Why do a chart and a tool sometimes disagree on the same paint?
They may use different source data or methods. Basecoat Lab calculates distance between approximate stored digital swatches; another chart may use community suggestions or a different formula. Treat either result as a candidate to test.
Which should I trust for a large batch conversion, like a whole army?
A tool is usually faster for a large batch because it processes every paint the same consistent way, but spot check a few results against a chart or your own eye before committing to the full order.